This article is an answer and interpretation to the ECG Case 155
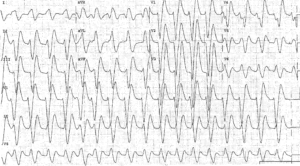
The ECG shows a regular rhythm at a rate of 140 bpm. There are no obvious P waves seen before or after any of the QRS complexes. However, there is a negative waveform seen after the T wave in lead V1 (▲).
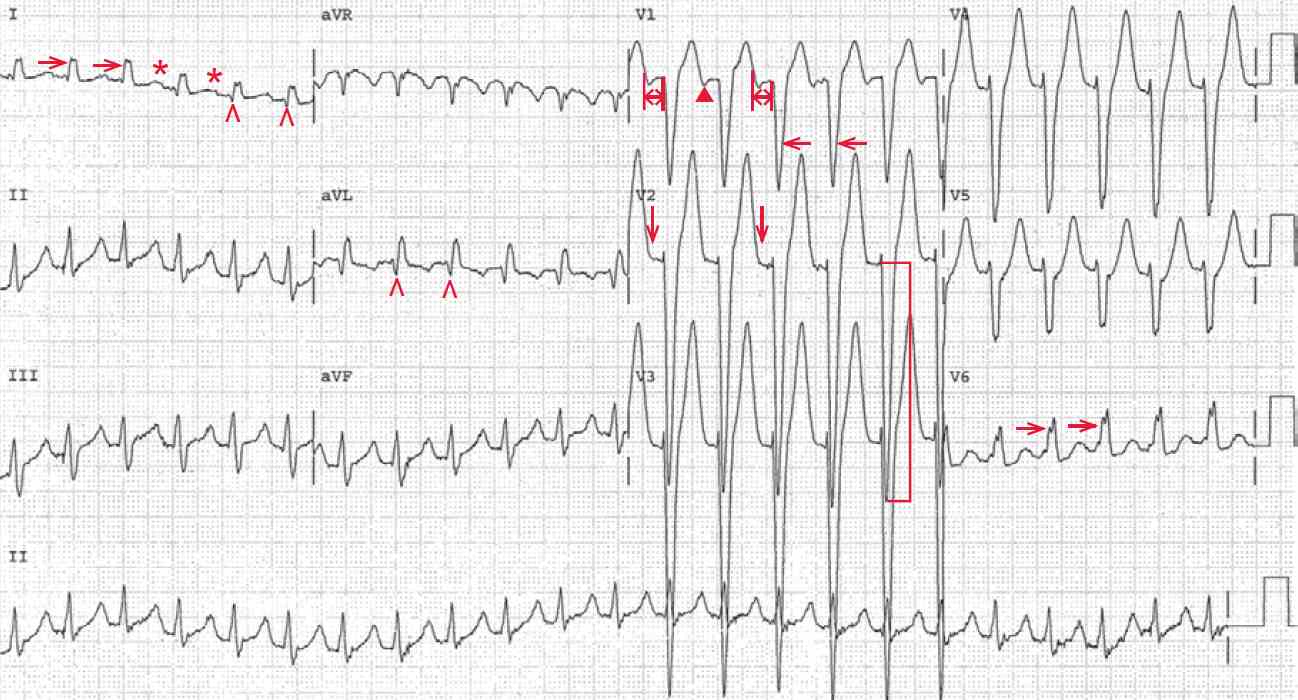
In addition, there is a subtle bump at the end of the T wave in lead V2 (↓), in lead V2 and notching of the T wave in lead I (+). This suggests a P wave superimposed at the end of the T wave. If this is a P wave, the PR interval (↔) is 0.18 second.
The QRS complexes are wide, with a duration of 0.14 second. The QRS morphology resembles that of a left bundle branch block (broad R wave in leads I and V6 [→] and a QS complex in lead V1 [←]).
However, there are septal Q waves seen in leads I and aVL (^). Septal Q waves cannot be seen with a left bundle branch block, as these forces are due to initial septal activation originating from a small septal branch that comes from the left bundle. Hence there is no initial septal activation with a left bundle branch block. Therefore, the QRS complex manifests a nonspecific intraventricular conduction delay (IVCD), which is the result of diffuse impulse slowing through the normal His-Purkinje system.
As the QRS complex has an IVCD, the activation of the ventricle uses the normal His-Purkinje system with slowed conduction. Since the activation is along the normal conduction system, abnormalities of the left ventricular myocardium can be identified.
In contrast, with a left bundle branch block, the activation of the left ventricle is not along the normal conduction system, but occurs via an abnormal pathway directly utilizing the ventricular myocardium. Hence left ventricular abnormalities cannot be identified.
As this case shows an IVCD, there is tall QRS complex voltage, ie, S wave in leads V2–V3 = 46 mm ( ] ), consistent with left ventricular hypertrophy (ie, an R wave or S wave > 25 mm in any precordial lead).
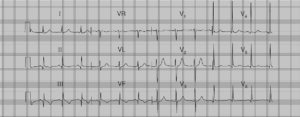
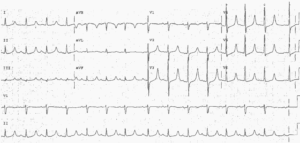
The following day upon the return of lucidity, a follow-up ECG is obtained. There is a regular rhythm at a rate of 72 bpm. There is a P wave (+) before each QRS complex with a stable PR interval (0.18 sec). This is the same as the presumed PR interval in the previous ECG.
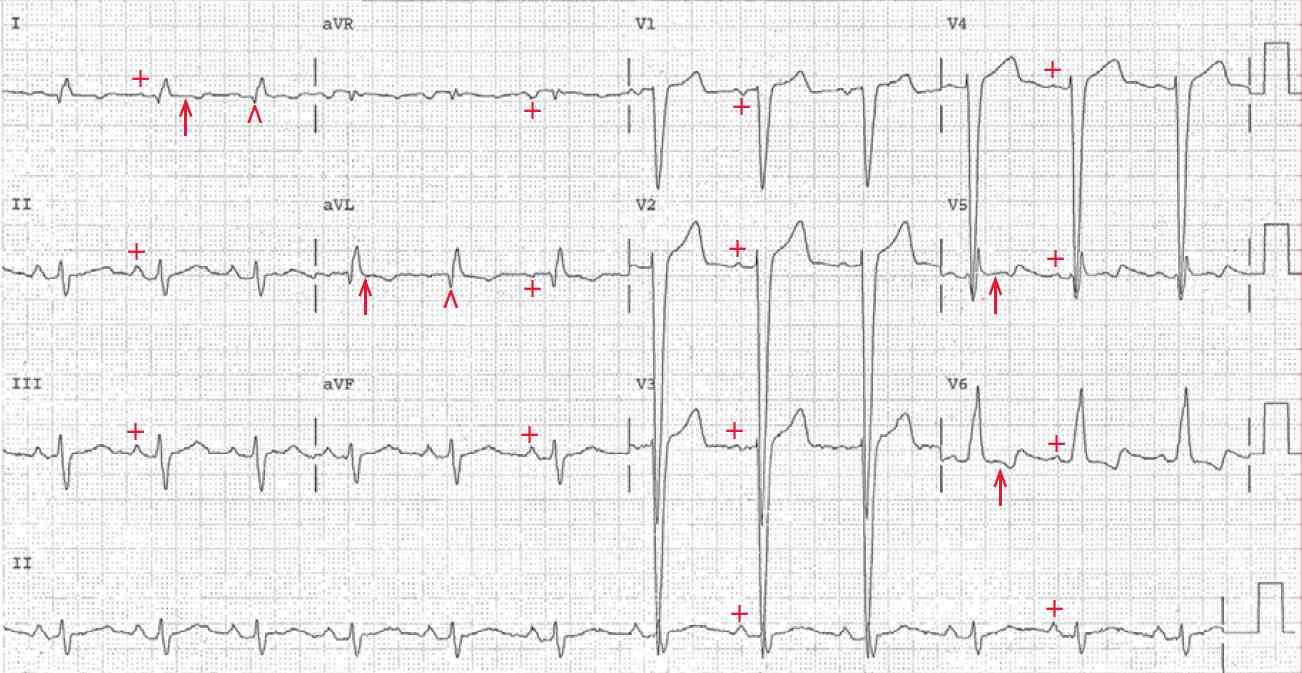
Noted is the fact that there is no negative deflection seen after the T wave in lead V1, supporting the fact that this waveform seen in the previous ECG was indeed the P wave and not part of the T wave. The QRS complex morphology and width (0.14 sec) are identical to what was seen in the previous ECG.
Although the QRS morphology resembles a left bundle branch block, there are septal Q waves in leads I and aVL (^); hence this is an intraventricular conduction delay (IVCD).
There are ST-T wave abnormalities noted in leads I, aVL, and V5–V6 (↑). These are likely secondary to left ventricular hypertrophy. By comparing the two ECGs, it can be seen that the first ECG showed a sinus tachycardia with an IVCD that was also present at baseline during normal sinus rhythm. Hence this is not a rate-related aberration, but is an IVCD due to a preexisting IVCD.
Sinus tachycardia is always physiologic, the result of sympathetic activation or elevated catecholamines. It is likely that the sinus tachycardia is the result of the episode of delirium, which is generally associated with sympathetic activation.
- READ MORE: ECG Interpretation – All you need to know
- SIMILAR CASE: Sinus Tachycardia with Left Bundle Branch Block (LBBB)