Table of Contents
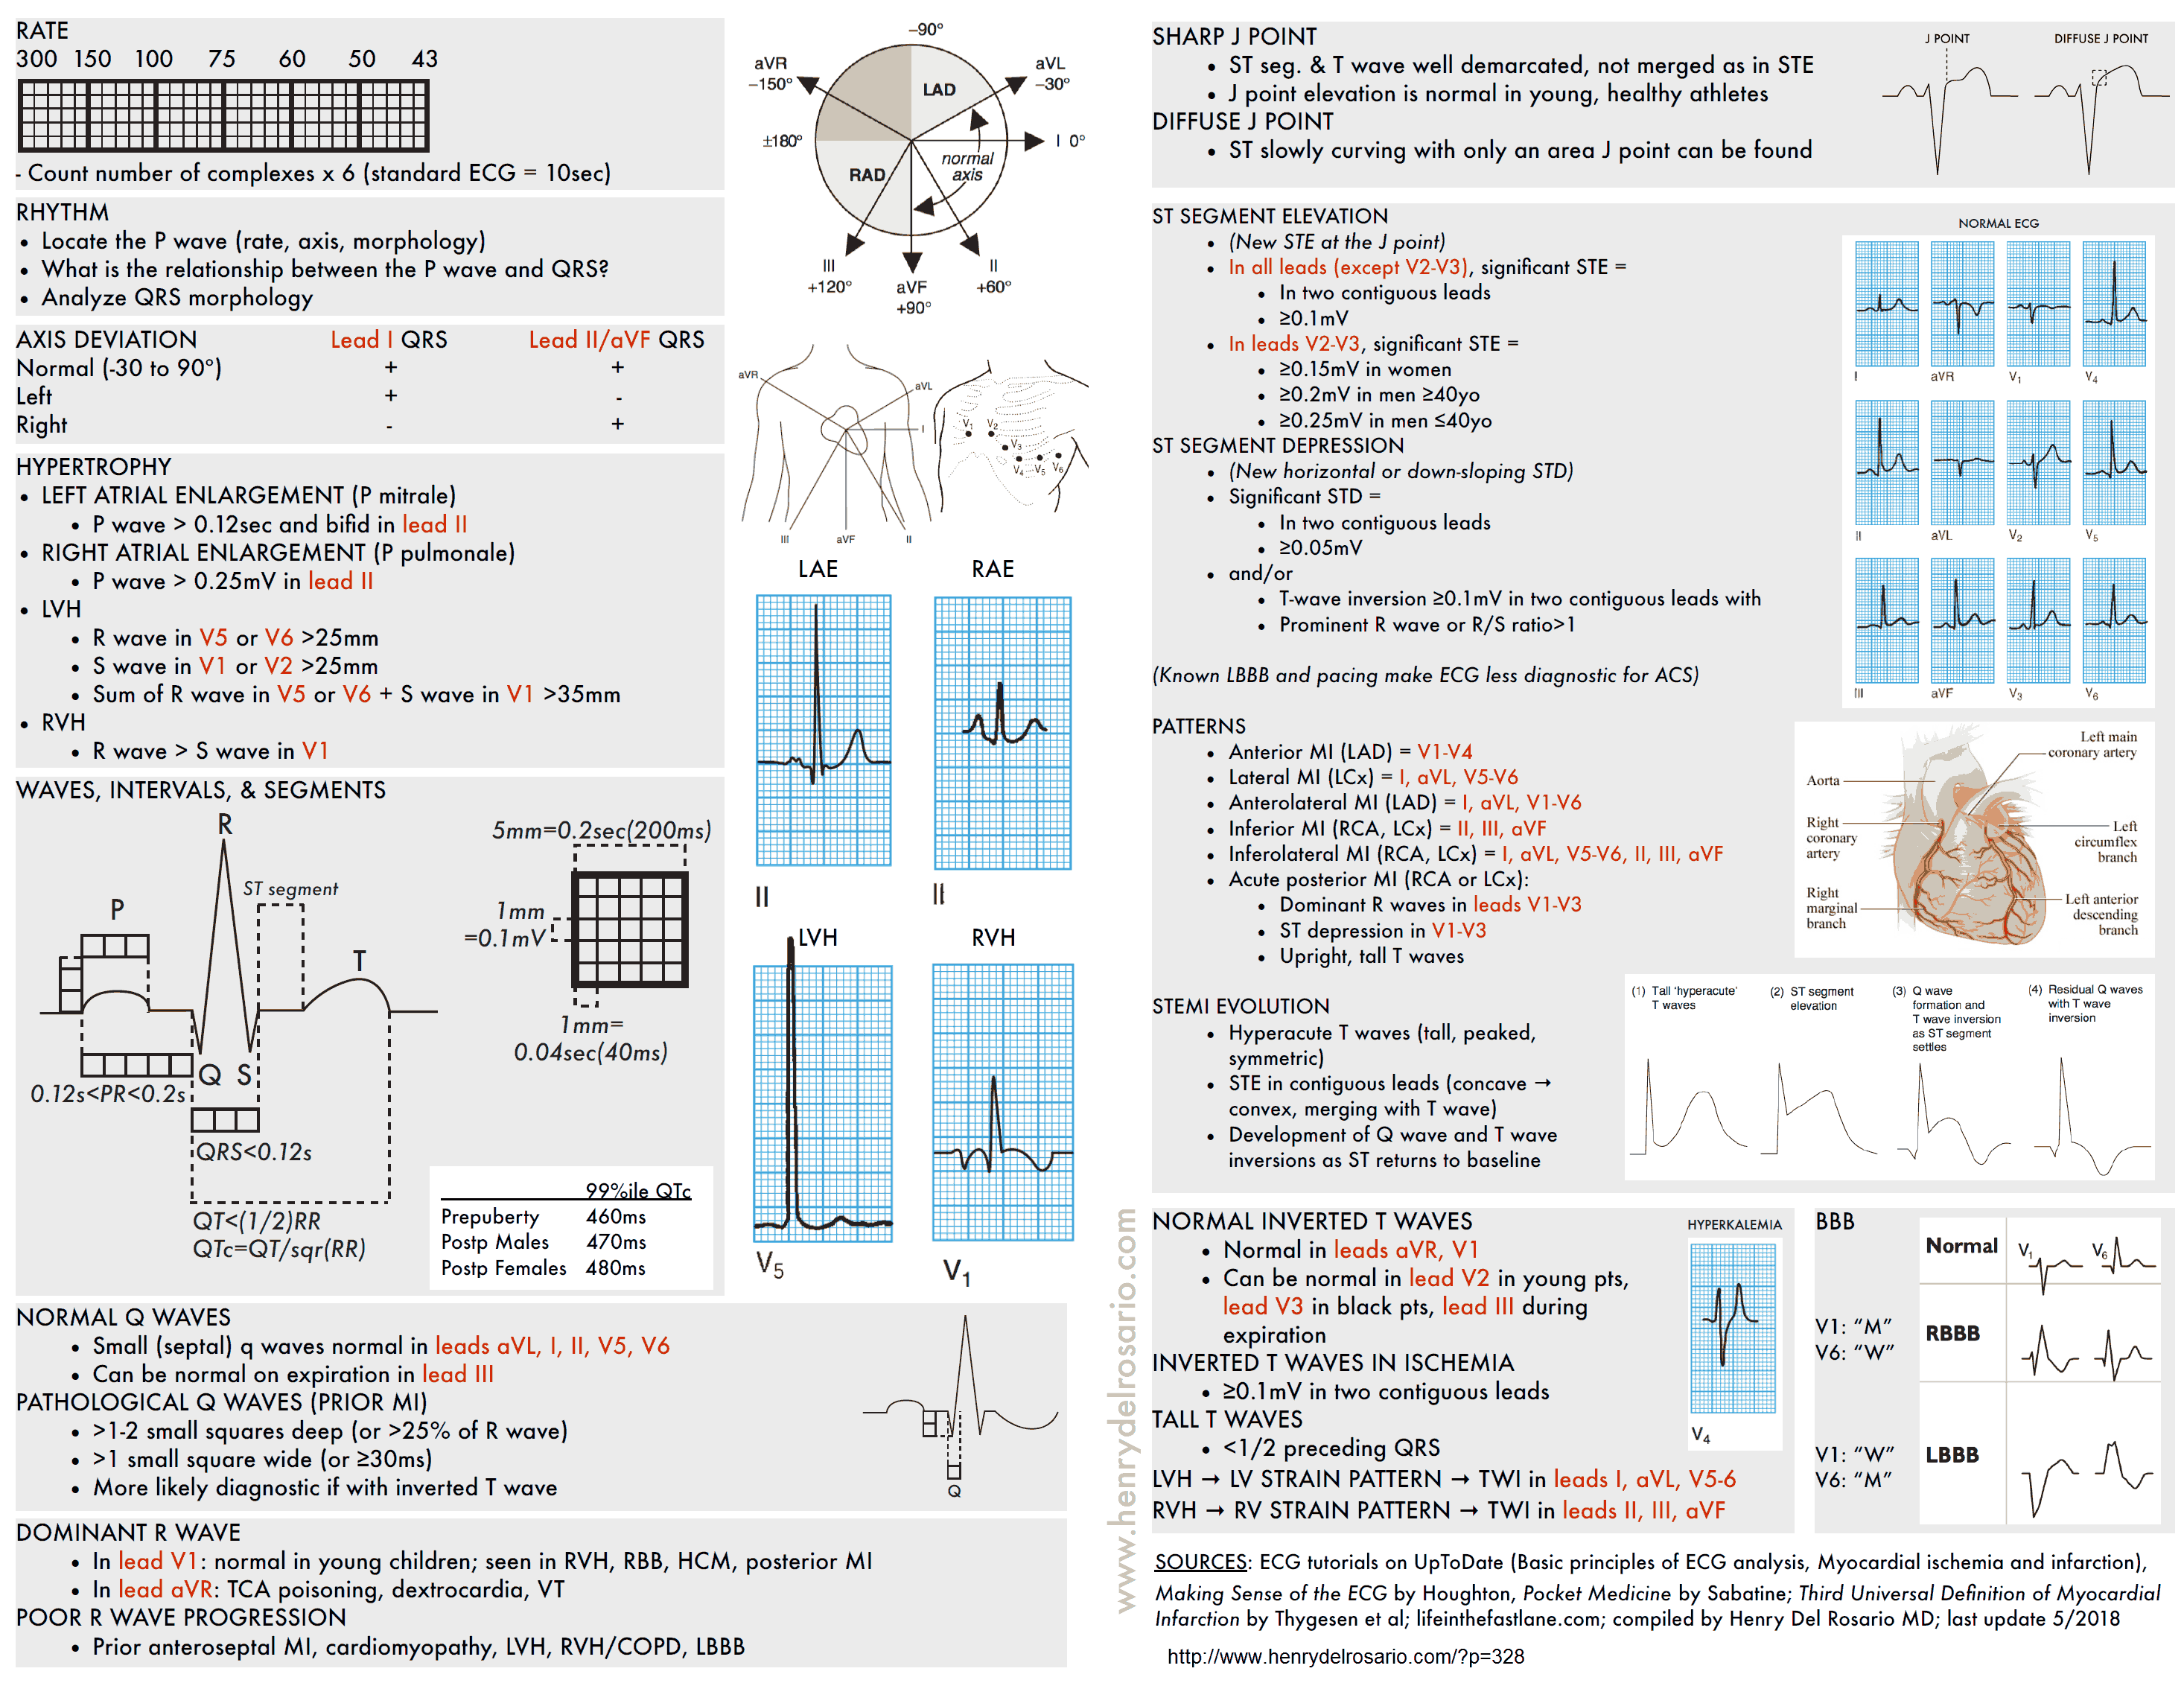
Approach all EKGs systemically. Always note: rate, rhythm, QRS axis, complexes and intervals, chamber enlargement, ischemia/infarction, compare with prior EKG.
Rate (atrial, ventricular)
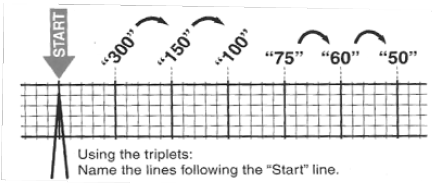
- If the rhythm is regular, use the counting method (300 / # large boxes).
- If the rhythm is irregular, count R waves in the rhythm strip and multiply by 6 (EKG printoutsrecord 10 seconds)
- Normal 60-100bpm; <60bpm is bradycardia, >100bpm is tachycardia
Rhythm (regular or irregular; sinus vs. non-sinus)
- Sinus rhythm defined as: P before every QRS, regular w/ rate 60-100, P wave upright in Leads I, II, aVF, V5-6
- P waves/morphology: Determine :
- If a P wave is present (best leads to visualize P wave are II and V1)
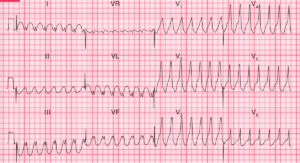
- The atrial rate (100-180 : sinustachycardia; 140-220 : atrial tachycardia, AVNRT, AVRT; 260-320 : atrial flutter)
- Axis (P wave upright in II and biphasic in V1)
- QRS morphology:
- Narrow (<120ms) – supraventricular rhythm.
- Wide (>120ms) – aberrant supraventricular conduction or ventricular origin
- P wave/QRS complex association:
- If not 1:1 association, determine if number of P>QRS (AV block) or P<QRS (accelerated junctional or ventricular rhythm).
- If P precedes QRS, evaluate the PR interval. If P after QRS, evaluate the RP interval and determine if PR or RP interval is fixed or variable
QRS Axis
- Normal axis (-30 to 90º): QRS complex is positive (upright) in leads I and II
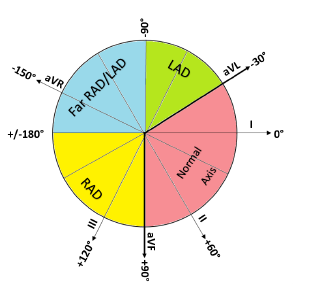
- Leftward Axis – Left Axis Deviation(LAD) (-30 to -90º): QRS complex is positive in lead I but negative in lead II
- Differential Diagnosis of Leftward Axis (Left Axis Deviation):
- normal variant
- mechanical shifts
- LVH (left ventricular hypertrophy)
- LBBB (Left bundle branch block)
- LAFB (Left anterior fascicular block)
- congenital heart disease
- emphysema
- hyperKalemia
- ventricular ectopic rhythms
- WPW (Wolff-Parkinson-White)
- inferior MI
- Differential Diagnosis of Leftward Axis (Left Axis Deviation):
- Rightward axis – Right Axis Deviation (RAD) (90 to 180º): QRS complex is negative in lead I and positive in leads II, aVF
- Differential Diagnosis of Rightward Axis Right Axis Deviation (RAD):
- normal variant
- mechanical shifts
- RVH (Right Ventricular Hypertrophy)
- LPFB (Left Posterior Fascicular Block)
- dextrocardia
- ventricular ectopic rhythms
- WPW
- lateral MI
- (NB: RBBB rarely causes RAD)
- Differential Diagnosis of Rightward Axis Right Axis Deviation (RAD):
- Extreme axis deviation/northwest axis (180 to -90º): QRS complexes negative in both I and II
- Differential Diagnosis of Extreme axis deviation/northwest axis:
- Lead transposition
- ventricular ectopic rhythms
- hyperkalemia
- artificial pacing
- severe RVH (Right Ventricular Hypertrophy)
- Differential Diagnosis of Extreme axis deviation/northwest axis:
- Clockwise/counterclockwise rotation (i.e. “R wave progression”): R wave amplitude typically increases from V1 to V5, with transition of R>S in amplitude at V3 or V4.
- Counterclockwise transition occurs prior to V3 due to:
- RVH (Right Ventricular Hypertrophy)
- WPW
- LAFB
- posterior MI
- Clockwise transition occurs after V4 due to :
- cardiomyopathy
- LVH
- LBBB
- anterior MI
- Both Clockwise and counterclockwise rotation are nonspecific and can be normal (Am Heart J 2004;148:80)
- Counterclockwise transition occurs prior to V3 due to:
- Low voltage: Average QRS amplitude < 5 mm in I, II, III and < 10 mm in precordial leads
- Differential Diagnosis of Low voltage QRS complex:
- obesity
- pericardial effusion
- pneumothorax
- COPD
- restrictive or infiltrative CM (particularly amyloidosis)
- severe hypothyroidism
- anasarca
- Differential Diagnosis of Low voltage QRS complex:
Complexes and Intervals
P wave: Right and left atrial depolarization; normal duration <120ms
PR interval:
- Atrial depolarization, AV node and His-Purkinje conduction.
- Normally 140-200ms, changes with rate (shortened at faster rates, longer at lower rates – due to autonomic effects on AV nodal conduction)
QRS:
- Ventricular depolarization.
- Normal duration 60-100ms, not influenced by Heart Rate.
- QRS 100-120ms is seen with incomplete BBB or interventricular conduction delay (IVCD);
- QRS > 120ms represents:
- BBB (Bundle Branch Block)
- ventricular activation (PVC, VT, fusion beats, WPW, paced beats)
- hyperKalemia
- Na channel poisoning
- aberrancy
- hypothermia
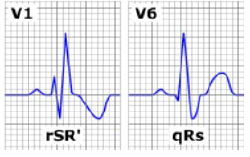
- RBBB:
- QRS > 120
- V1 with rSR’
- V6 with wide qRS
- Lead I will show a shallow broad S
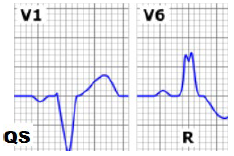
- LBBB:
- QRS > 120 mm
- V1 with wide negative QS
- V6 with wide tall R
- LAFB:
- Left axis deviation (-45 to -90) w/ QRS < 120
- qR in I, aVL
- rS in II, III, aVF
- Common, nonspecific
- LPFB:
- Bifascicular block: RBBB with either LAFB or LPFB
ST segment: Represents a time of electrical silence. See “Ischemia/Infarction”
T-wave:
- Ventricular repolarization, with a slow upstroke and a rapid return to the isoelectric line after peaking.
- Usually asymmetric and in the same direction as the QRS. Should have smooth contours (bumps in T are usually buried P waves)
U wave:
- occurs in the same direction as T wave
- rate-dependent (shorter at faster rates)
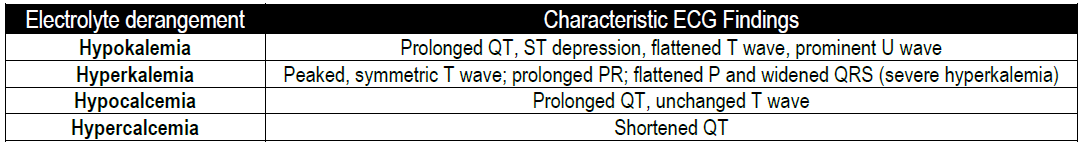
- differential diagnosis: bradycardia, hypoKalemia / Mg /Ca , hypothermia
QT interval:
- Ventricular depolarization and repolarization
- Excludes U-wave unless fused with the T wave
- Rate-dependent (shortened at faster rates)
- Normal <440ms in men, <460ms in women
Chamber Enlargement
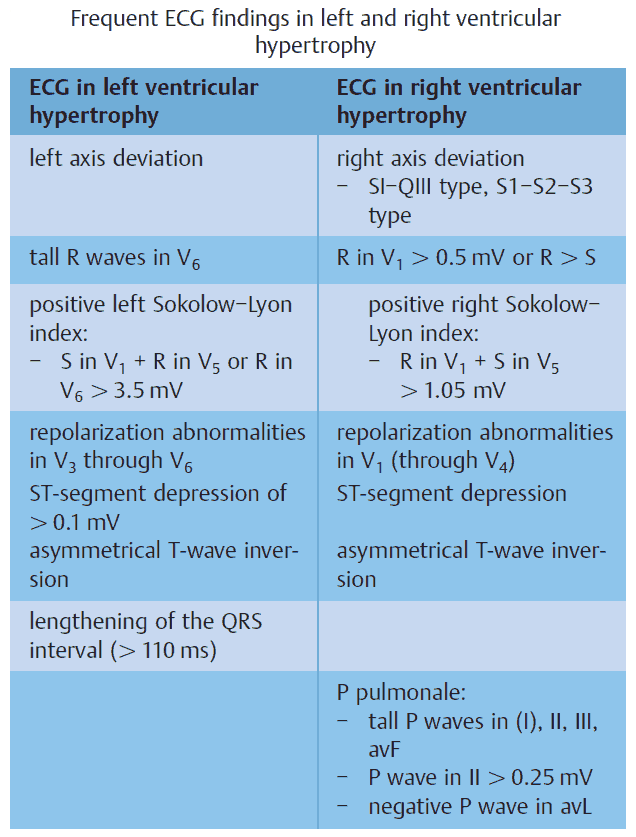
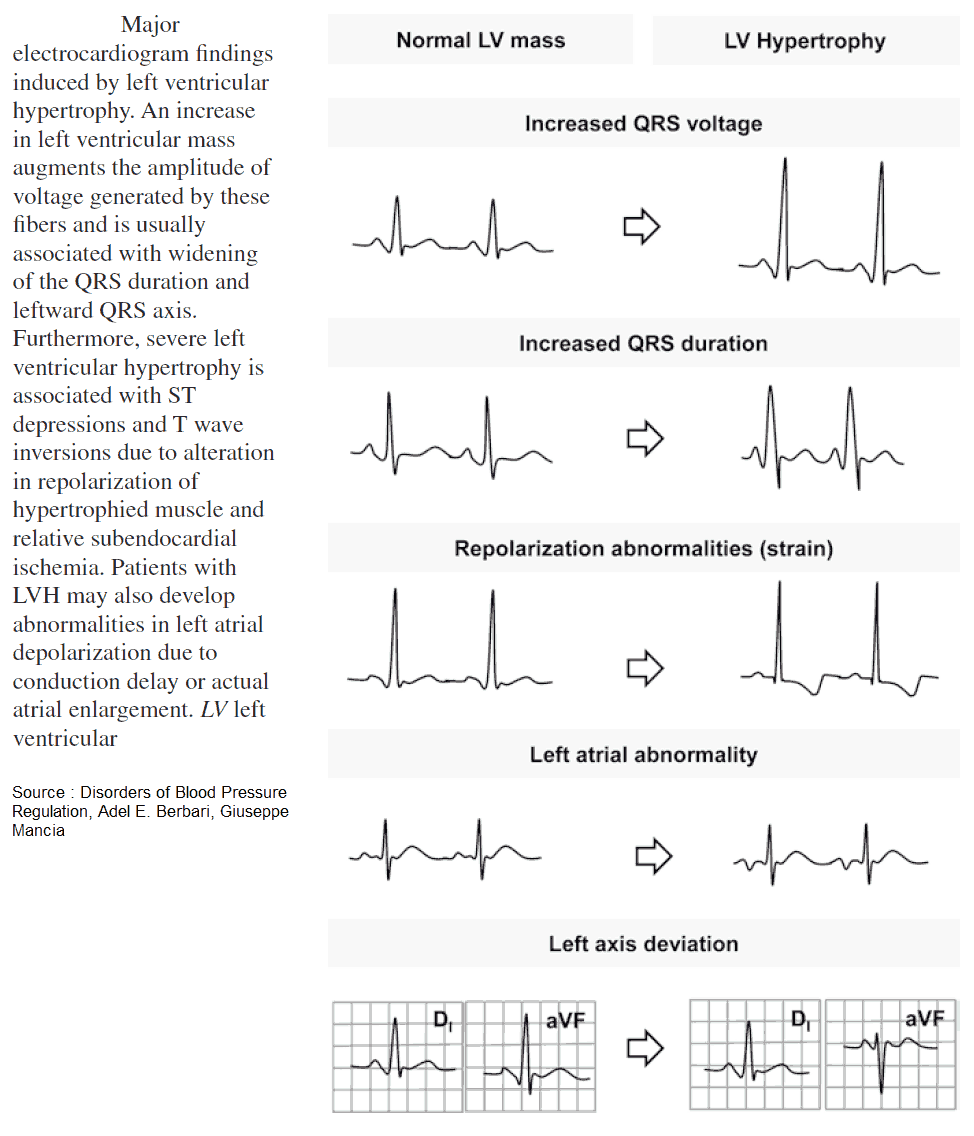
- LVH:
- Sokolow-Lyon criteria: S in V1+ R in V5 or V6 ≥35mm OR R in aVL ≥11mm.
- Cornell criteria: S in V3+ R in aVL > 28mm (men) or 20mm (women)
- RVH: R>S or R ≥7mm in V1, S ≥7mm in V5 or V6
- LAE: negative p wave in V1 >1mm wide and deep, total p wave duration >110ms in II
- RAE: p wave >2.5mm in lead II
READ MORE about Left Ventricular Hypertrophy (LVH): How to Recognize it on ECG [With Examples]
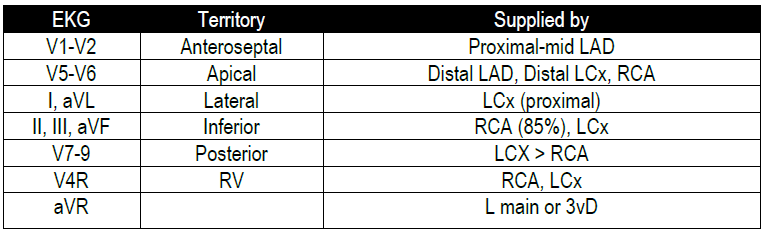
Ischemia/Infarction
- Analyze abnormalities along the vectors of ventricular depolarization and repolarization (QRS-ST-T)
- T-wave abnormalities:
- Hyperacute, symmetric T-waves can be found within minutes; followed by T wave inversions (≥0.1 mV in 2 contiguous leads)
- ST depression:
- Suggests subendocardial injury;
- ≥0.05 mV below the baseline (PR segment), measured at the J point, in two contiguous leads, downsloping or horizontal = more ominous.
- ST depressions do not localize to territories (Circ Res 1998;82;957) NB: always look for ST elevations to rule out reciprocal ST depression.
- Digoxin toxicity: scooping ST depressions.
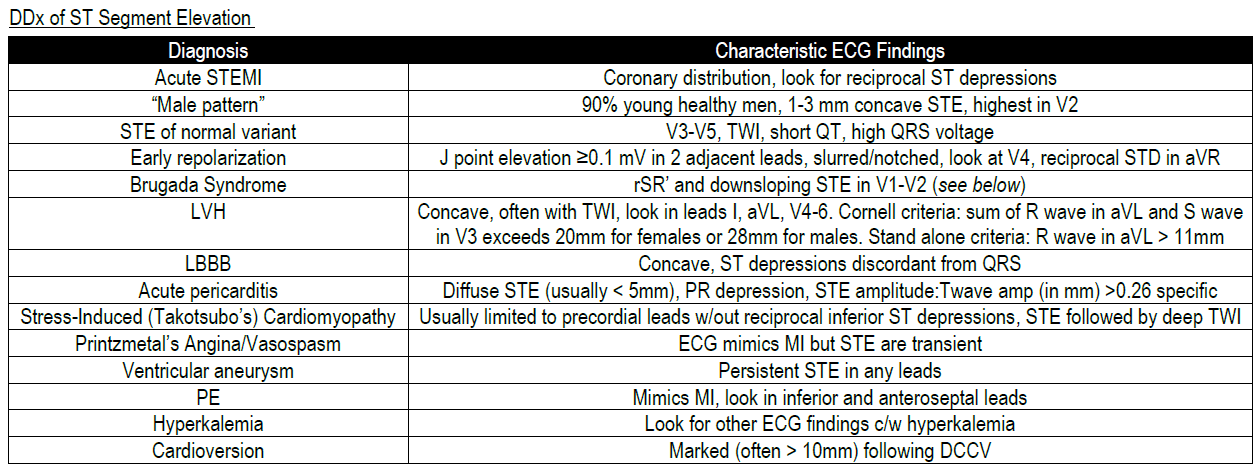
- ST elevation:
- Suggests transmural ischemia;
- ≥0.1 mV, except for leads V2 to V3 (≥0.2 mV in men ≥40yo and ≥0.15 mV in women), measured at the J point.
- PR segment is the isoelectric interval on the ECG and can be used to assess ST segment elevation/depression.
READ MORE: Know the Differential for ST Segment Elevation, It’s More Than Just ACS
- Q-wave:
- Usually a marker of scar;
- Must be deep (>1 mm) and broad (>0.04 seconds), more likely prior MI if inverted T wave in same lead.
- Pathologic Q wave defined by
- 40ms duration (1 box wide),
- 25% height of QRS.
- “Isolated Q in III is free” (non-pathologic).
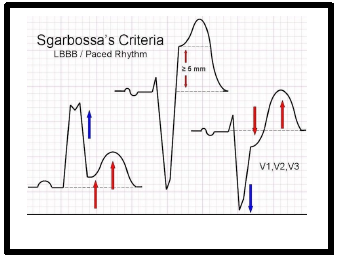
- Sgarbossa Criteria:
- Used to diagnose acute MI in presence of LBBB. Score of 3 = 90% Sp
- Concordant STE > 1mm in any lead = 5 points;
- Discordant STE > 5 mm in any lead = 2 points;
- ST depression > 1 mm in V1- V3 = 3 points.
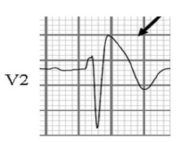
- Wellens’ Syndrome:
- Sign of critical prox LM (Left Main) or proximal LAD lesion, 75% MI in <2wks.
- Patient often pain free with history of angina.
- Normal/slightly elevated troponin.
- Symmetric, deeply inverted T waves or biphasic T waves in V2 + V3.
- Isoelectric or minimally elevated (<1mm) ST segment.
- No precordial Q waves. (Am J Emerg Med 2002;20:7)
Electrolyte Abnormalities
J-point Elevation Syndromes
Early repolarization:
- ST segment elevation in absence of chest pain, terminal QRS slur, or terminal QRS notch
- Features suspicious for malignant forms of ER:
- 1) Family history of sudden cardiac arrest or early unexplained death.
- 2) evalution and workup suggestive of a channelopathy.
- 3) history of unheralded syncope suggestive of an arrhthmogenic pathogensis (Circ 2016; 133:1520)
Brugada Syndrome (Circ Arrhythm Electrophys 2012;5:606)
- Autosomal dominant, SCN5A loss of function mutation in 10-30% pts
- Male > Female, more common to have nocturnal cardiac arrest
- p/w VT/VF or sudden cardiac death
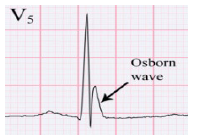
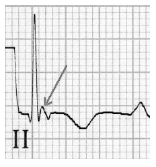
Osborn Wave
- Hypothermia, T<93 F
- Elevation of J point height roughly proportional to degree of hypothermia (n.b. neg in V1 & aVR)
Epsilon Wave
- Found in ARVC (Arrhythmogenic right ventricular cardiomyopathy)
- Most specific in V1 (30% w/ ARVC)
- Low frequency, positive terminal deflection in V1-V3
READ ALSO about Pearls in Syncope ECG Interpretation