This article is an answer to the ECG Case 165
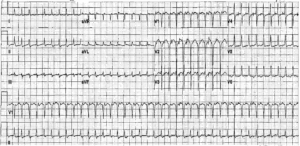
ECG 109A shows a regular rhythm at a rate of 60 bpm. There is a P wave (+) before each QRS complex with a stable PR interval (0.18 sec). The P wave is positive in leads I, II, aVF, and V4–V6. Hence this is a sinus rhythm.
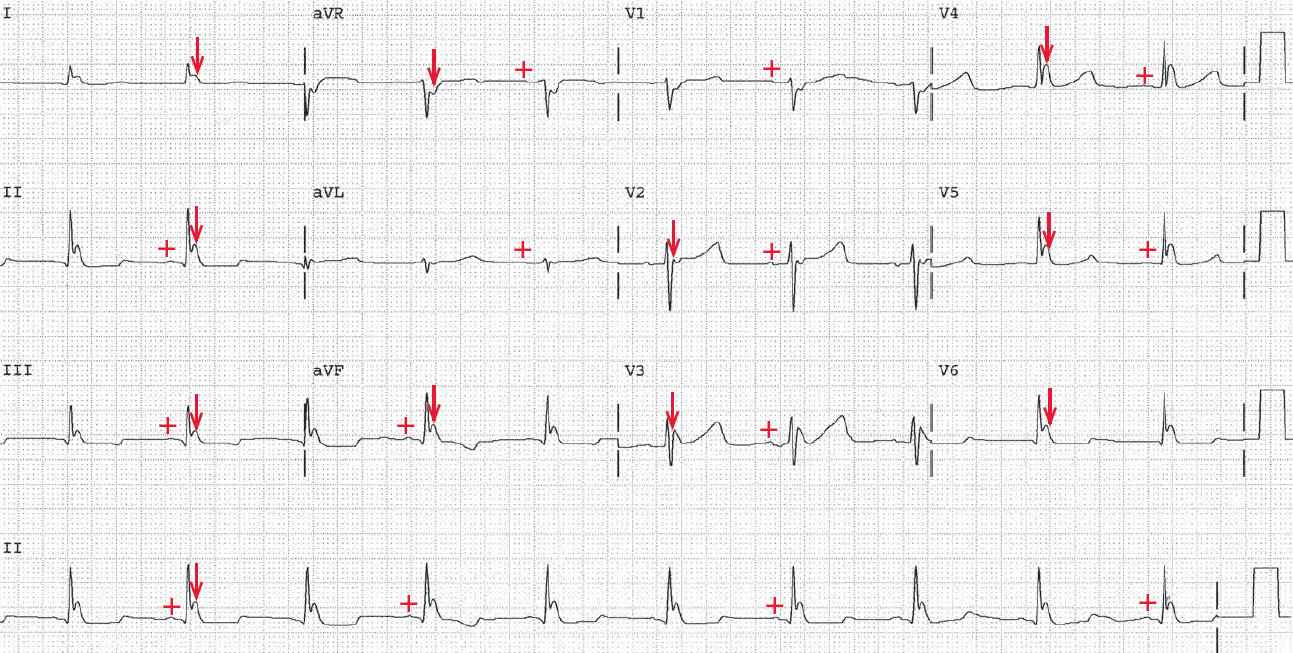
The QT/QTc intervals are slightly prolonged (480/480 msec). Following the QRS complex, at the J point, is an abnormal waveform (↓) that is significantly elevated. This is termed a J wave or Osborn wave, and it is the result of hypothermia that may be due to exposure, inadequate warming after cardiac surgery, or therapeutic hypothermia in sudden cardiac death survivors.
Upon admission to the emergency department, this patient’s temperature was 89°F. In addition to the Osborn wave, hypothermia is also associated with prolongation of the QT interval.
The normal ventricular myocardium has three electrophysiologically distinct layers of cells: epicardial, endocardial, and M cells. These three cell types have different electrophysiologic properties, primarily related to the rate of repolarization and hence action potential duration.
The rate of repolarization can be altered by temperature changes; this especially affects the epicardial and M cells. Therefore, with hypothermia there is an increase in the dispersion of repolarization across the ventricular wall, accounting for the Osborn wave.
This abnormality of early repolarization is also seen in the Brugada pattern, which is congenital resulting from a genetic abnormality of the SNC5A gene. The J point abnormality seen with Brugada pattern is over the right ventricular precordial leads (ie, V1–V3). Temperature changes, such as hyperthermia, can also affect the Brugada pattern, making it more pronounced.