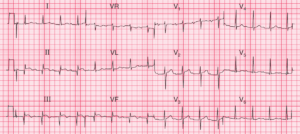
Left Ventricular Hypertrophy (LVH) causes tall R waves in the leads that ‘look at’ the left ventricle – I, aVL, V5 and V6 – and the reciprocal (‘mirror image’) change of deep S waves in leads that ‘look at’ the right ventricle – V1 and V2.
There are many criteria for the ECG diagnosis of left ventricular hypertrophy, with varying sensitivity and specificity. Generally, the diagnostic criteria are quite specific (if the criteria are present, the likelihood of the patient having left ventricular hypertrophy is >90 per cent), but not sensitive (the criteria will fail to detect 40–80 per cent of patients with left ventricular hypertrophy).
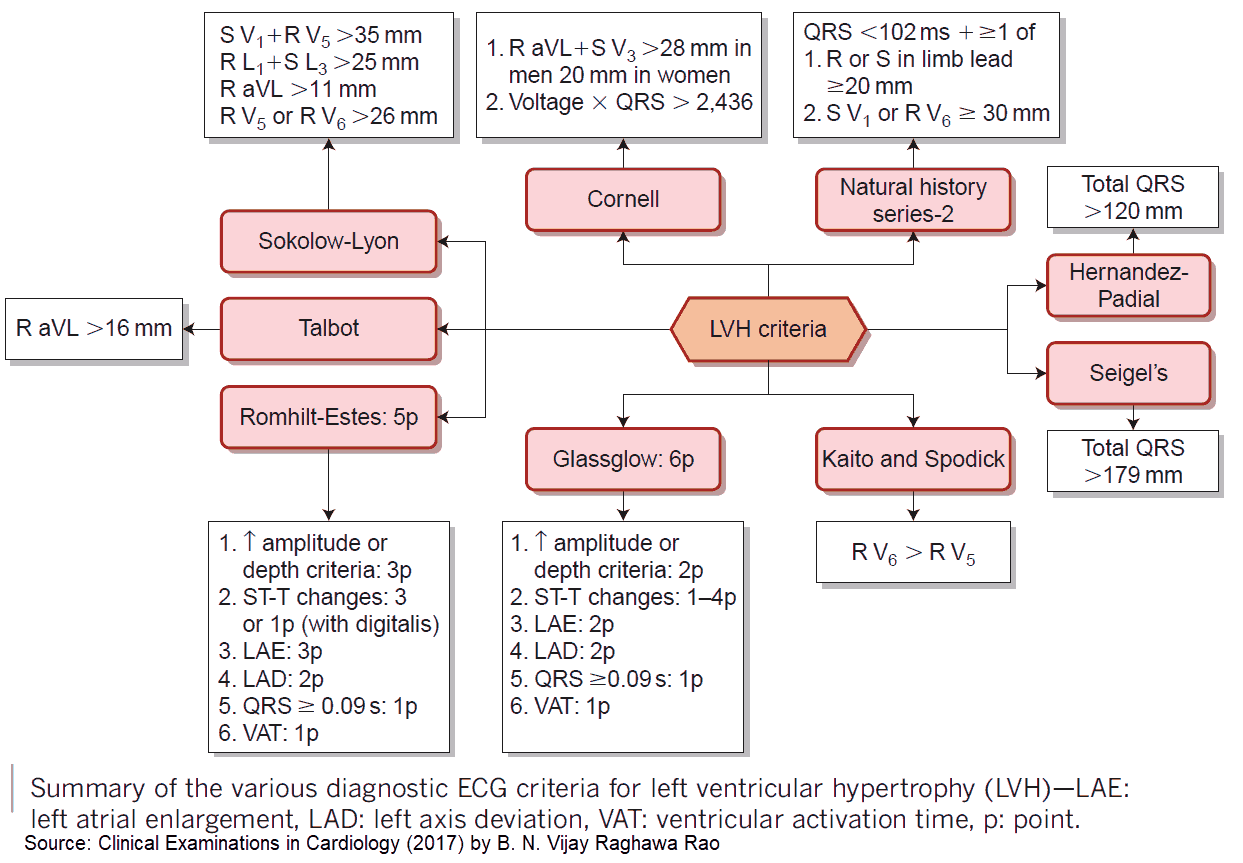
Diagnostic ECG Criteria for Left Ventricular Hypertrophy (LVH)
- In the limb leads:
- R wave >11 mm in lead aVL
- R wave >20 mm in lead aVF
- S wave >14 mm in lead aVR
- sum of R wave in lead I and S wave in lead III >25 mm.
- In the chest leads:
- R wave of ≥25 mm in the left chest leads
- S wave of ≥25 mm in the right chest leads
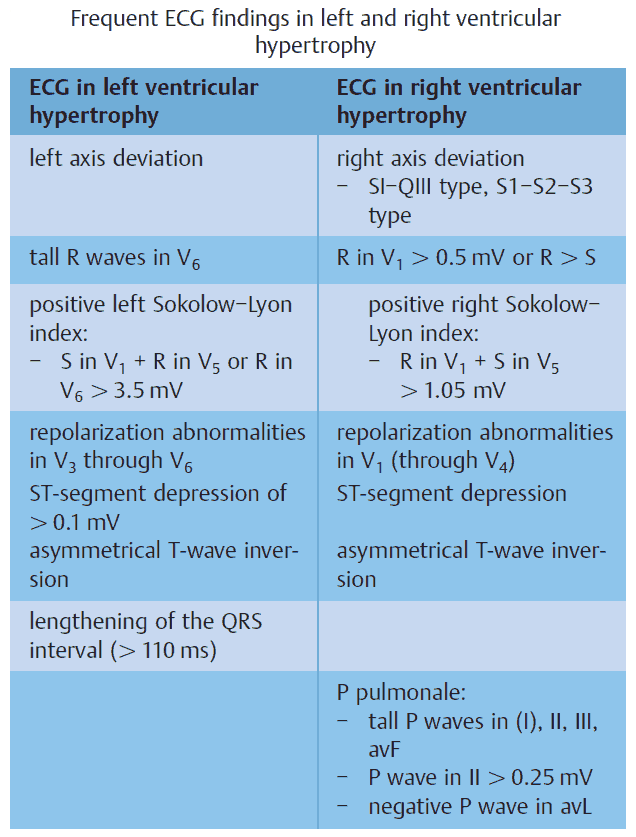
- sum of S wave in lead V1 and R wave in lead V5 or V6 >35 mm (Sokolow–Lyon criterion)
- sum of tallest R wave and deepest S wave in the chest leads >45 mm.
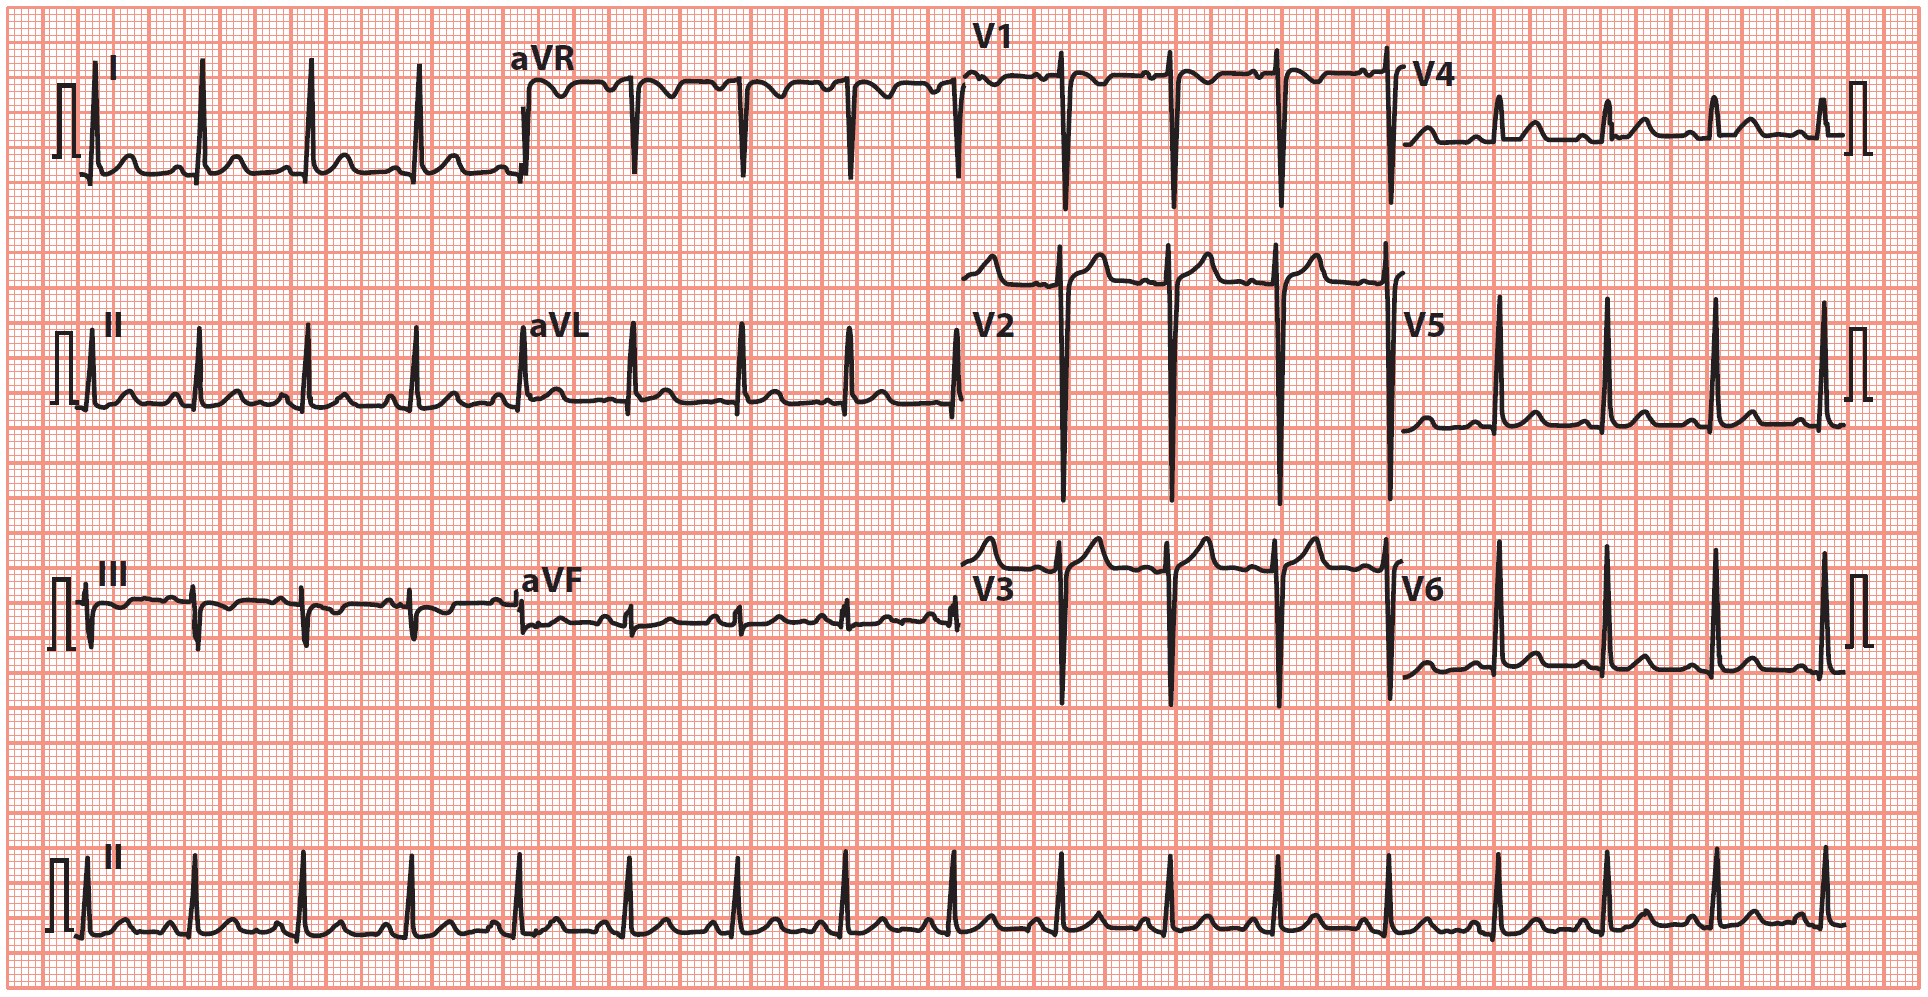
Tall R waves in leads I, aVL, V5 and V6, with deep S waves in leads V1, V2 and V3.
The Cornell criteria involve measuring the S wave in lead V3 and the R wave in lead aVL. Left ventricular hypertrophy is indicated by a sum of >28 mm in men and >20 mm in women.
The Romhilt–Estes scoring system allocates points for the presence of certain criteria. A score of 5 indicates left ventricular hypertrophy and a score of 4 indicates probable left ventricular hypertrophy. Points are allocated as follows:
- 3 points – for (a) R or S wave in limb leads of ≥20 mm, (b) S wave in right chest leads of ≥25 mm, or (c) R wave in left chest leads of ≥25 mm
- 3 points – for ST segment and T wave changes (‘typical strain’) in a patient not taking digitalis (1 point with digitalis)
- 3 points – for P-terminal force in V1 >1 mm deep with a duration >0.04 s • 2 points – for left axis deviation (beyond –15°)
- 1 point – for QRS complex duration >0.09 s
- 1 point – for intrinsicoid deflection (the interval from the start of the QRS complex to the peak of the R wave) in V5 or V6 >0.05s.
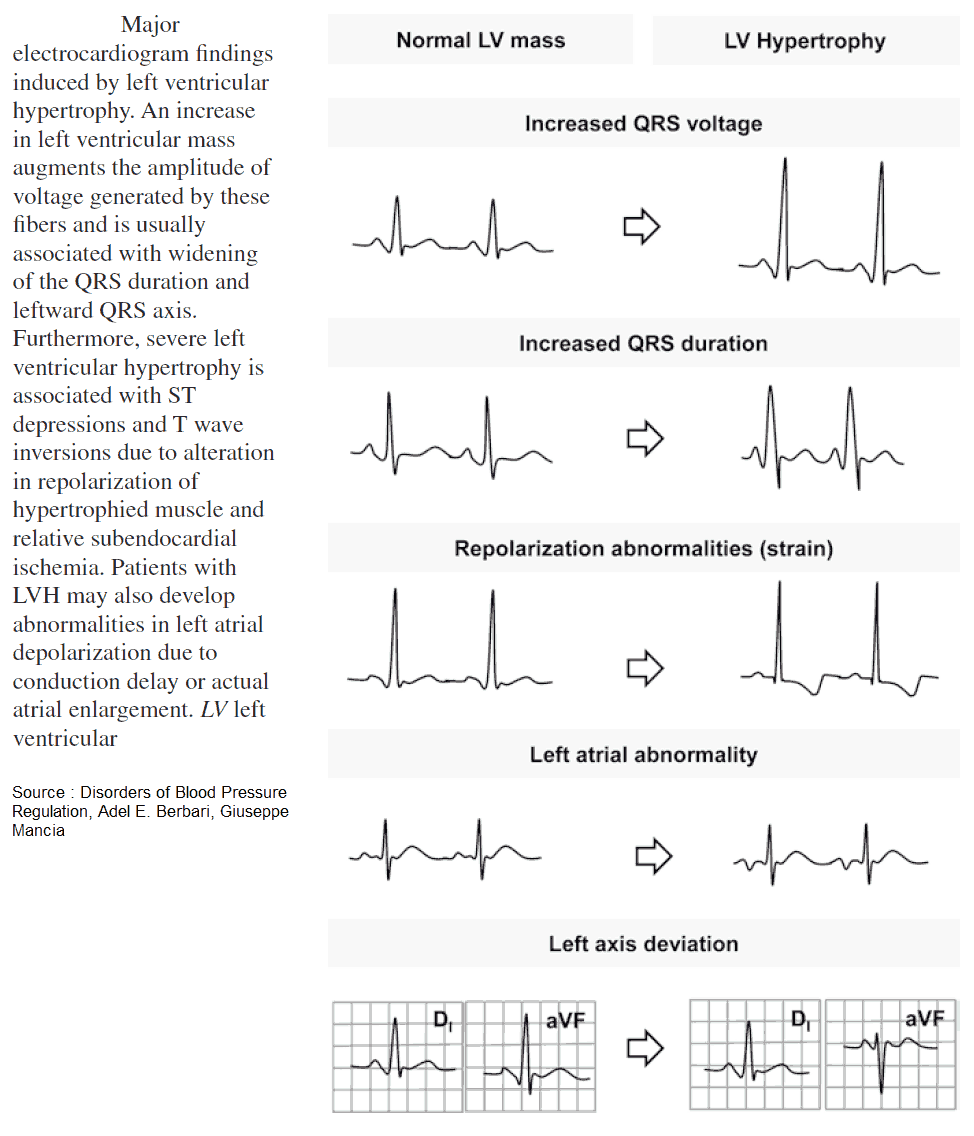
Other ECG Changes in Left Ventricular Hypertrophy (LVH)
- If there is evidence of left ventricular hypertrophy on the ECG, look also for evidence of ‘strain’ pattern in left sided leads:
- ST segment depression
- T wave inversion.
- Left atrial enlargement (LAE)
- Left axis deviation (LAD)
- ST segment elevation in the right precordial leads V1-3 (“discordant” to the deep S waves)
- U waves
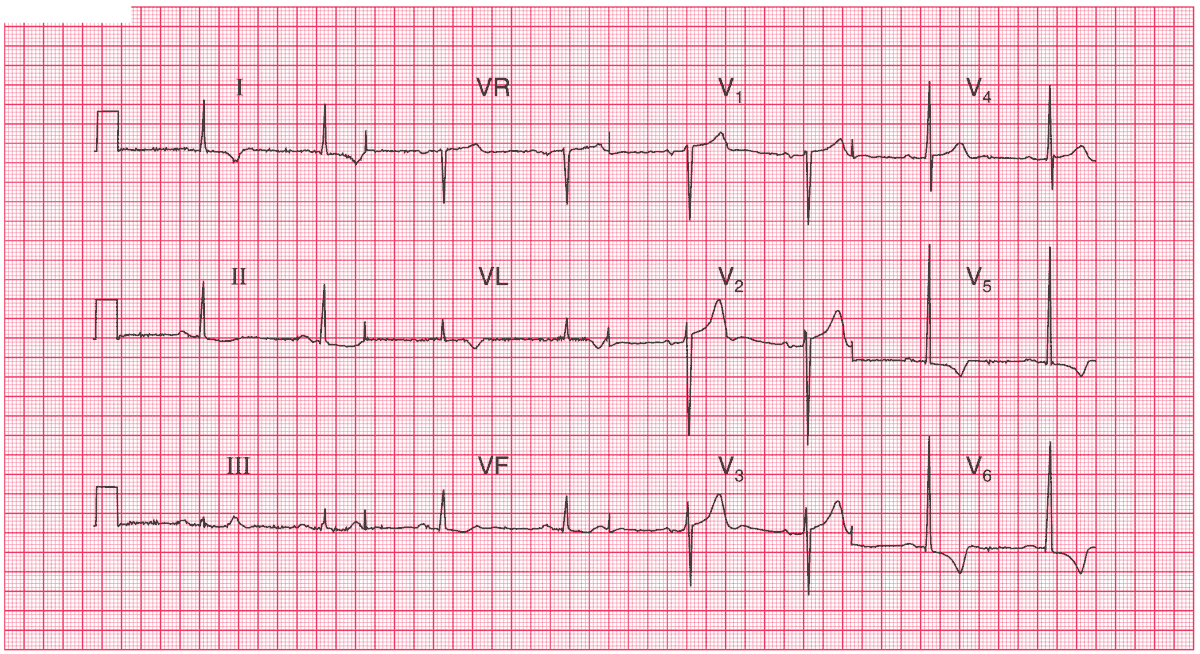
R wave height in lead V5 is 30 mm, and the S wave depth in lead V2 is 25 mm.
T wave inversion in leads I, VL, V5–V6 (strain pattern).
Causes of Left Ventricular Hypertrophy (LVH)
- Hypertension
- Aortic stenosis
- Aortic regurgitation
- Mitral regurgitation
- Coarctation of the aorta
- Hypertrophic cardiomyopathy
- READ MORE about ECG Interpretation: All you need to know
- ECG Cases with Left Ventricular Hypertrophy
References / Further Reading
- Bauml MA, Underwood DA. Left ventricular hypertrophy: an overlooked cardiovascular risk factor. Cleveland Clinic J Med 2010; 77: 381–387.
- Hancock EW, Deal BJ, Mirvis DM, et al. AHA/ACCF/HRS recommendations for the standardization and interpretation of the electrocardiogram: Part V: Electrocardiogram changes associated with cardiac chamber hypertrophy. J Am Coll Cardiol 2009; 53: 992–1002.