This is an answer and interpretation to the ECG Case 154
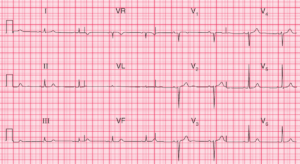
The ECG shows a regular rhythm at a rate of 66 bpm. There is a P wave (*) before each QRS complex, with a stable PR interval (0.14 sec). The P waves are upright in leads II, III, aVF, and V4-V6 and negative in lead aVR. This is a normal sinus rhythm.
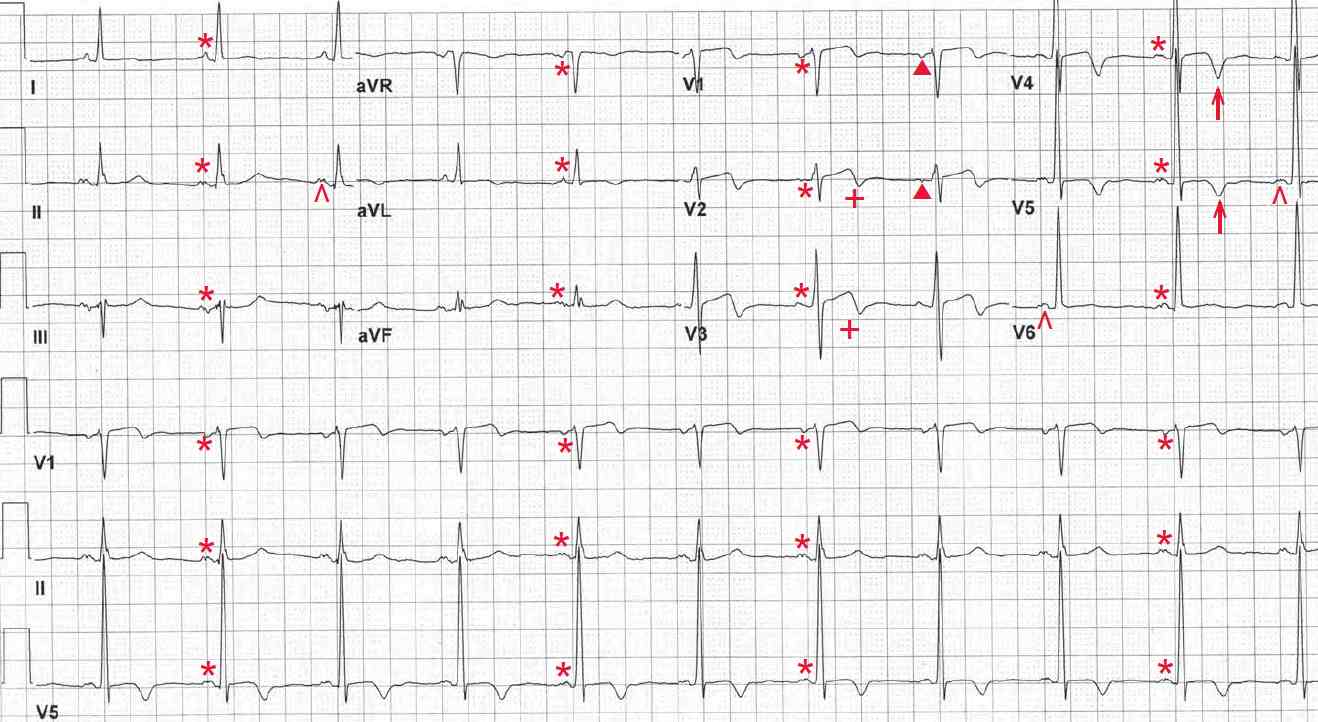
The P waves are prominently notched in leads II and V5-V6 (^) and are primarily negative in leads V1-V2 (▲). This is consistent with left atrial hypertrophy or a left atrial abnormality.
The T waves are biphasic (+) in leads V1-V3 and negative (↑) in leads V4-V5. Although T-wave inversions are nonspecific, they are meaningful when associated with a clinical story that is characteristic for discomfort due to myocardial ischemia.
Although not completely typical (as the T waves are biphasic in leads V2-V3), the T-wave changes seen in this ECG are suggestive of Wellens’ syndrome. Wellens’ T waves are deep and symmetrically inverted T waves in leads V2-V4 or V5. This pattern should alert the clinician to a potential high left anterior descending coronary artery (LAD) stenosis.
This pattern is frequently overlooked by treating physicians because it is not a typical pattern of ischemia. Nonetheless, this could represent a potentially unstable LAD plaque.
If the frequency of angina is increasing or is occurring at rest, indicating an unstable pattern, the patient should be evaluated using coronary angiography rather than exercise stress testing. However, if the angina has a stable pattern, exercise testing is reasonable.